Tired of wrestling with quantifiable data? Easy Graph simplifies data tracking and management. Monitor electricity usage, or any metric, with ease. This user-friendly app lets you input daily data, instantly visualized in clear value graphs and growth charts. Export your data as a text file for deeper analysis. Easy Graph provides efficient monitoring and reporting – a must-have for anyone needing to keep tabs on their key metrics.
Easy Graph Key Features:
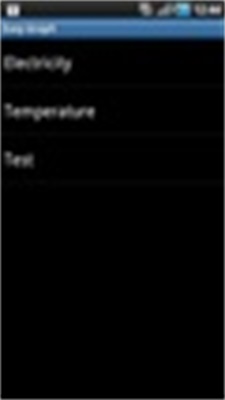
- Effortless Data Management: Easily track and manage your quantifiable data sets. Perfect for monitoring metrics like energy consumption.
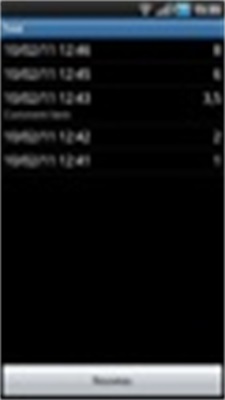
- Streamlined Data Input: Manage multiple date/value lists with a simple, intuitive interface. Convenient daily data entry.
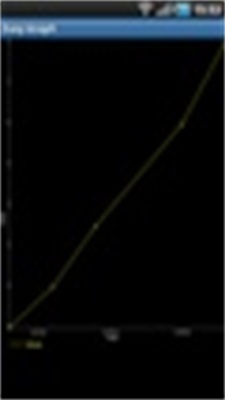
- Clear Visualizations: Understand your data at a glance with value graphs and growth line charts. Easily identify trends and progress.
- Data Export: Export your datasets as text files for further analysis on your computer. Ideal for in-depth reporting.
- Intuitive Interface: Efficient monitoring and reporting are made simple through a user-friendly graphical display.
- Permissions: Requires internet access (primarily for ads) and external storage access (for data export). These permissions are crucial for optimal functionality.
In Conclusion:
Easy Graph offers a seamless experience for efficient data management. Whether for personal or professional use, its simple data entry, clear visualizations, and export functionality make tracking and understanding your metrics a breeze. Download Easy Graph today for hassle-free data management.